20 Best Market Research & Consumer Survey Templates for 2026
Start collecting responses
Turn this into a shareable survey
Draft the questions, publish a clean link, and keep every response organized in FormHug.
37% of US consumers now cite rising prices as their number-one concern, according to Conference Board data from early 2026 — but that headline number conceals the question that actually matters for business decisions: which prices, for which consumers, in which spending categories? Brands and researchers that can answer that question with first-party data hold a structural advantage over those relying on market reports that capture the average without capturing the segments.
First-party market research — surveys you design, distribute, and own — gives you the segmentation that syndicated research doesn’t. A McKinsey consumer report tells you what happened. A well-designed consumer survey tells you what’s happening to your specific audience right now, and why. The difference between those two data sources is often the difference between a reactive strategy and a proactive one.
These 20 templates cover the two most valuable market research categories for 2026: the SaaS and technology landscape (tool fatigue, AI replacement anxiety, no-code adoption, startup stacks) and the broader society and consumer trends picture (Gen Z shopping habits, economic confidence, cost of living, tariff impact, AI regulation, social media behavior, and education). Each template links directly to a ready-made FormHug form you can deploy immediately.
TL;DR — These 20 market research templates give teams a structured way to collect first-party data on the SaaS landscape and consumer trends shaping 2026 — from tool fatigue to Gen Z shopping habits to AI regulation.
- SaaS & technology surveys — tool stack benchmarking, AI vs SaaS replacement risk, no-code adoption, subscription spending, tool fatigue
- Consumer & society surveys — Gen Z shopping habits, economic confidence, cost of living, AI regulation opinion, social media usage, education + AI
- Works for: market researchers, product managers, founders, startup teams, policy researchers, and journalists
- All templates are free and produce exportable data for reporting and publishing
Quick Comparison: 20 Market Research & Consumer Survey Templates
| Template | Best for | Primary data captured |
|---|---|---|
| 2026 SaaS Stack Survey | Startup/SMB tool benchmarking | Tools actively used, spend, team size |
| 2026 Tool Fatigue Survey | Subscription overload research | Too-many-tools sentiment, cancellation intent |
| 2026 AI vs SaaS Replacement Survey | AI displacement benchmarking | Which SaaS categories respondents would replace with AI |
| 2026 Form Builder Usage Survey | Form tool competitive intelligence | Typeform/Tally/Jotform vs AI-native builders |
| 2026 No-code vs AI Tools Survey | Builder tool adoption patterns | No-code maturity, AI builder adoption overlap |
| 2026 Productivity Tools Survey | Knowledge worker stack | Notion/Linear/Slack/Loom adoption by role |
| 2026 Startup Tools Stack Survey | Founder tool benchmarking | Early-stage stack, monthly spend, favorites |
| 2026 Subscription Spending Survey | SaaS pricing research | Monthly subscription spend, willingness to consolidate |
| 2026 AI Regulation Opinion Survey | AI policy opinion research | Regulation support level, trust in regulators |
| 2026 Data Privacy & AI Survey | Trust & consent research | AI data use consent, GDPR awareness, trust signals |
| 2026 Social Media Usage Survey | Platform behavior research | Platform usage patterns, algorithm trust, Gen Z shifts |
| 2026 News Trust Survey | Media credibility research | AI-generated news detection, source trust levels |
| 2026 Global Conflict Impact Survey | Consumer anxiety benchmarking | Geopolitical concern impact on spending |
| 2026 Economic Confidence Survey | Macro sentiment tracking | Recession confidence, spending intention changes |
| 2026 Cost of Living Survey | Consumer financial pressure | Specific cost categories causing the most strain |
| Gen Z Shopping Habits Survey Template | Teen and youth consumer research | Shopping channels, brand discovery, price sensitivity |
| 2026 Education & AI Survey | EdTech + AI intersection | AI classroom use, teacher/student dual perspective |
| 2026 Online Learning Satisfaction Survey | EdTech product feedback | Coursera/Udemy satisfaction, completion behavior |
| 2026 Future of Work Survey | Macro workforce trends | AI, automation, skills, career outlook |
| 2026 Consumer Tariff Impact Survey | Tariff impact on purchase behavior | Purchase timing changes, category shifts |
SaaS & Technology Landscape Surveys
The SaaS market is experiencing two simultaneous pressures in 2026: subscription fatigue on one side (too many tools, too much spend, too much context-switching) and AI disruption on the other (which categories will AI-native tools make obsolete, and how fast?). These eight templates help you measure those dynamics with first-party data rather than analyst predictions.
A comprehensive benchmarking tool for understanding what tools startups and SMBs are actually running, not just what they’ve purchased. The template covers the full stack: project management, communication, CRM, analytics, design, finance, and AI. For SaaS founders and product researchers, the data it produces is directly useful for competitive positioning — first-party stack data from your own distribution is a fundamentally different signal than any analyst prediction. For growth teams, it identifies where your audience’s attention is already allocated.
Subscription fatigue is one of the most resonant pain points in the knowledge worker segment right now: too many tools, too many logins, too much monthly spend, and too much context-switching between apps that don’t talk to each other. This template captures how widespread that fatigue is, which categories generate the most friction, and how many respondents are actively planning to consolidate or cancel. For SaaS founders, the data identifies where the consolidation wave is heading next — and which categories are most vulnerable.
2026 AI vs SaaS Replacement Survey
The most forward-looking template in the SaaS category. It asks which existing software categories respondents believe AI tools will replace in the next 12–24 months — and which ones they’ve already started replacing. The answers vary enormously by respondent type (developers vs marketers vs founders), which makes the segmentation data particularly valuable. For product teams considering where to invest AI features, this survey surfaces where users expect disruption versus where they expect continuity. For organizations measuring internal AI adoption alongside this external market view, the AI & productivity survey templates cover employee-level AI usage, policy, and ROI measurement.
2026 Form Builder Usage Survey
Competitive intelligence specifically for the form and survey tool category. It maps usage across Typeform, Tally, Jotform, Google Forms, and AI-native builders — capturing which tools respondents use for which use cases, what their switching barriers are, and how they evaluate form tools when making a purchase decision. FormHug tracks this data quarterly to understand competitive positioning, feature priorities, and where AI-native form functionality creates the clearest differentiation from legacy tools.
2026 No-code vs AI Tools Survey
The no-code community and the AI tools community overlap significantly but are not the same — this template maps that overlap. It captures where respondents are in their no-code journey, which AI-powered builders they’ve adopted alongside traditional no-code tools, and how the two tool types are interacting in their workflow. For Bubble, Webflow, and Glide users, the survey surfaces how AI is changing their tool selection calculus. For AI builder companies, it identifies the migration opportunity from the no-code segment.
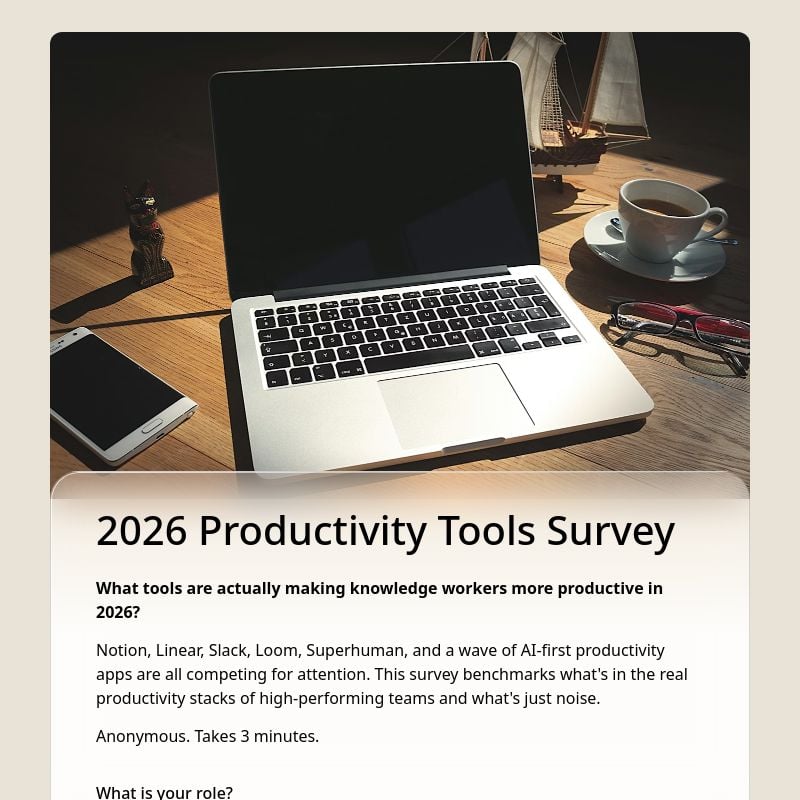
2026 Productivity Tools Survey
Focused specifically on the knowledge worker stack — Notion, Linear, Slack, Loom, Obsidian, and the tools that orbit them. It captures which tools are in active daily use versus which are aspirational (in the stack but rarely opened), and which AI features within productivity tools respondents actually find valuable versus which they ignore. Useful for productivity tool founders who want to understand feature adoption beyond DAU/MAU metrics, and for researchers building knowledge worker behavior reports.
2026 Startup Tools Stack Survey
Designed specifically for the early-stage founder audience — the segment that’s most deliberate about tool choices because every dollar and every hour matters. This template captures the tools founders rely on at pre-seed and seed stage, monthly spend per category, how they discovered their stack, and what they’d cut if forced to reduce. For YC-community-adjacent audiences, the data produces publishable benchmarks that resonate with the founder audience’s interest in peer comparison.
2026 Subscription Spending Survey
How much are individuals and teams actually spending on software subscriptions monthly — across personal tools, team tools, and AI subscriptions? This template captures the actual spend figure alongside the perceived value, the number of active vs lapsed subscriptions, and the threshold at which total subscription spend triggers a consolidation review. For SaaS pricing researchers, the data is directly useful for understanding the competitive envelope that their target segment is operating within.
Society, Consumer Trends & Economic Sentiment
Consumer behavior in 2026 is being shaped by several simultaneous pressures: economic squeeze, platform-level shifts in social discovery, geopolitical anxiety, and the technological disruption of AI entering everyday life. These 12 templates help you measure those forces — whether for original research, thought leadership content, or audience intelligence.

37% of US consumers cite rising prices as their number-one concern, but the aggregate number obscures the spending categories under the most pressure. This template captures which specific cost categories — housing, groceries, healthcare, childcare, transportation, subscriptions — are driving the most financial strain, and what behavioral changes respondents are making in response. For brands and researchers, the category-level data is what’s actionable; the headline satisfaction score is not.
2026 Consumer Tariff Impact Survey
31% of US consumers changed their purchase timing due to tariff concerns in early 2026, according to Conference Board research. This template measures that behavior more specifically: which product categories respondents have pulled forward or deferred, whether tariff awareness has shifted brand or country-of-origin preferences, and how confident they are about making large purchases in the next 90 days. For retailers and e-commerce teams, the purchase timing data is a direct input to inventory and promotion planning.
2026 Economic Confidence Survey
A macro-level consumer sentiment template that captures overall economic confidence, near-term spending intention, and the specific factors most contributing to uncertainty. It distinguishes between respondents experiencing a K-shaped recovery (those whose financial position is stable or improving) and those facing genuine economic pressure — a segmentation that’s essential for understanding apparent contradictions in aggregate consumer sentiment data. Useful as both a standalone study and as a demographic variable to cross-tabulate against other survey results.
2026 Global Conflict Impact Survey
Conference Board data shows a significant spike in consumer anxiety tied to geopolitical events in 2025–2026. This template measures how that anxiety translates into specific behavioral changes: energy conservation, travel decisions, large purchase deferrals, and changes in media consumption. For brands with international exposure, the data helps distinguish between respondents whose behavior is genuinely affected by global events and those who report concern but haven’t changed their spending.
2026 AI Regulation Opinion Survey
A wave of US state-level AI employment laws passed in 2025 — and public opinion on AI regulation is sharply divided by age, political orientation, and AI usage frequency. This template captures where respondents stand on key regulatory questions: bias auditing requirements, transparency mandates, sector-specific restrictions, and trust in different regulatory bodies (government, industry, independent standards bodies). For policy researchers and AI companies with government affairs exposure, the segmented opinion data is directly useful.
GDPR and CCPA awareness levels vary enormously across the general population, but behavior doesn’t always track with stated preferences. This template measures not just what respondents say they believe about AI data use (high concern is near-universal) but what they actually do: which permissions they grant, which opt-outs they exercise, and what trust signals make them comfortable sharing data with AI systems. For companies designing AI products, the gap between stated privacy concern and actual behavior is the design space where trust is built or lost.
2026 Social Media Usage Survey
Platform-level behavioral shifts in 2026 include: Gen Z migration away from algorithmic feeds, rising distrust of platform curation, and growing time spent on smaller interest-specific communities versus mass-market platforms. This template measures those patterns: time by platform, trust in algorithmic recommendations, what drives follows and unfollows, and how respondents discover new creators or information. Useful for media companies, brands with social-first strategies, and researchers tracking platform ecosystem shifts.
Gen Z Shopping Habits Survey Template
Teen and youth consumer behavior research needs more than a generic shopping questionnaire. This template is built for market researchers studying how Gen Z and teenage audiences discover products, compare prices, respond to social proof, use creator recommendations, and decide which brands feel worth buying from in 2026. Use it when the research question is not simply “what did they buy?” but “which channels, values, constraints, and social signals shaped the purchase?” For a deeper question framework, see the Gen Z shopping habits survey template guide.
AI-generated news credibility is the primary media literacy concern of 2026 — respondents report increasing difficulty distinguishing AI-generated from human-written articles, and trust in online news sources has continued to decline. This template measures trust levels by source type (traditional outlets, independent journalists, social media), AI-generated news detection confidence, and what signals respondents use to evaluate credibility. For media organizations and researchers, the data provides a benchmark for how audience trust is distributed across the current information ecosystem.
AI in classrooms is the most contested EdTech topic of the decade — and teacher and student perspectives differ significantly on both adoption and appropriate use. This template captures both sides: teacher adoption of AI tools for curriculum design and grading, student use for research and writing, institutional policy awareness, and opinion on where AI assistance helps versus undermines learning. Useful for EdTech companies, educational researchers, and policy makers navigating AI in schools.
2026 Online Learning Satisfaction Survey
Post-COVID, online learning platforms (Coursera, Udemy, LinkedIn Learning) face the challenge of converting trial users into committed learners. This template captures the full learning experience: what motivated enrollment, where attention dropped off, what completion or abandonment looked like, and what would make the respondent recommend the platform. For EdTech product teams, the dropout pattern data is more valuable than NPS scores — it reveals the specific moments where engagement breaks down.
The broadest template in this collection — an umbrella survey that covers the macro forces reshaping work: AI and automation impact, skills development priorities, career confidence, preferred employment structures, and long-term economic outlook. The Gartner 9-trend framework for 2026 (AI augmentation, talent sustainability, organizational fluidity, and others) provides the conceptual scaffolding. Useful as a thought leadership anchor for companies wanting to publish original future-of-work research. Pair it with employee workplace survey templates for the internal workforce data that contextualizes this external-facing research.
How to Choose the Right Market Research Template
Are you studying your own customers or the general market?
Templates designed for customer-specific research (Tool Fatigue, Subscription Spending, Form Builder Usage) should go to your own users or target segment — the answers are most useful when you know something about who’s responding. General market research templates (Economic Confidence, Cost of Living, AI Regulation) are designed for broader distribution across demographic groups — they’re more useful as representative samples than as customer panels.
Is this a one-time study or a recurring benchmark?
Economic and consumer sentiment data depreciates quickly in 2026 — what was true in January may not be true in April. The Cost of Living, Economic Confidence, and Consumer Tariff Impact surveys are designed as quarterly benchmarks; running them once produces a snapshot, running them repeatedly produces the trend data that’s actually actionable. The SaaS and technology surveys (Tool Stack, Productivity Tools) are appropriate semi-annually — the underlying tool landscape moves fast but not weekly.
Are you publishing the results or keeping them internal?
Research designed for publication needs representative demographic segmentation — industry, company size, role, age, geography — to produce data that holds up to scrutiny. Add those fields before distribution. Internal-use surveys don’t need the same rigor, but do need the segmentation variables that matter for your specific decisions: for a B2B SaaS, company size and role are essential; for a consumer brand, income range and region matter most.
Do you need qualitative depth or quantitative breadth?
Most of these templates are quantitative — multiple choice survey questions, Likert scale questions, and ranking survey questions — designed to produce data that can be tabulated and reported. For topics where the reasoning matters as much as the result (AI regulation opinion, news trust, data privacy), add one or two open-ended survey questions at the end asking respondents to explain their most important answer. Qualitative responses are what produce the quotable moments that make research reports readable and shareable.
Final Recommendation
For teams that want to publish original research in 2026, the Economic Confidence Survey, Cost of Living Survey, and Consumer Tariff Impact Survey form a natural triptych: together they paint a complete picture of consumer financial psychology in the current environment. Distribute them in sequence, 4–6 weeks apart, and the trend data becomes the story.
For SaaS founders and product teams, the AI vs SaaS Replacement Survey and Tool Fatigue Survey together map both the threat (which categories will AI disrupt?) and the opportunity (where is fatigue-driven consolidation creating space for better products?). Run them with your target segment and you have competitive intelligence that no analyst report can match for specificity.
For education-focused teams, the Education & AI Survey and Online Learning Satisfaction Survey pair well as a two-phase study: the first captures opinion and behavior at the classroom level, the second captures the learner experience at the platform level.
All 20 templates are free to access, customize, and deploy. For a full overview of FormHug’s survey builder — question types, logic branching, and real-time analytics — see the survey maker feature page. Start your market research survey →
Frequently Asked Questions
What is a market research survey template?
A market research survey template is a pre-built set of questions designed to collect structured data about market conditions, consumer behavior, industry trends, or competitive dynamics. Templates reduce the time required to design valid, structured surveys from scratch and ensure you’re capturing the data most relevant to a specific research question — rather than defaulting to generic satisfaction questions that don’t produce actionable insights.
How do I get enough responses for market research surveys to be statistically valid?
For most market research purposes, 200–400 responses produce data with acceptable confidence levels at a standard margin of error (±5% at 95% confidence). For tightly segmented research (specific industry or demographic), you may need fewer responses to see clear patterns within that segment. Distribution methods matter as much as sample size: email lists, social distribution, community forums, and paid panels each produce different respondent populations — be explicit about which you used when reporting results.
Can I use these templates to publish original industry research reports?
Yes. Templates like the SaaS Stack Survey, AI vs SaaS Replacement Survey, Future of Work Survey, and Economic Confidence Survey are structured specifically to produce publishable data. Add demographic questions (industry, company size, role, geography) before deployment, and include methodology notes (sample size, distribution channel, fielding dates) when you publish. Original research reports with clear methodology are among the highest-performing content types for B2B SEO and brand credibility.
How do I handle sensitive topics like economic anxiety or geopolitical opinion in a survey?
Frame sensitive questions with neutral language and avoid loaded terms. “How has your financial situation changed in the past 12 months?” produces more honest data than “How much are you struggling financially?” For opinion topics (AI regulation, news trust), provide balanced answer options that don’t suggest a preferred response. Always explain why you’re collecting the data — respondents are more forthcoming when they understand the research purpose and how results will be used.
Are these survey templates GDPR compliant?
FormHug processes survey responses in accordance with GDPR requirements. For surveys distributed to EU residents, include a brief data notice explaining what’s collected, the purpose, and your retention policy. Anonymous surveys (no identifying information collected) have the lightest compliance footprint. For surveys collecting personal data alongside responses, consult your privacy team before deployment. FormHug’s data processing agreement is available to Pro plan users.
How long should a market research survey be?
For public distribution surveys (where you have no prior relationship with respondents), keep the survey under 5 minutes (typically 8–12 questions). Response rates drop sharply beyond 5 minutes for cold audiences. For panel surveys or surveys sent to your own customers, 10–15 minutes is acceptable if you explain the purpose and offer an incentive. The templates in this collection are designed to fall in the 3–7 minute range, balancing depth with completion rate.

Written by
FormHug TeamProduct, research, and form automation team
The FormHug Team brings together product builders, workflow researchers, and form automation practitioners who study how people collect, route, and act on information online. Our guides are based on hands-on product testing, template analysis, customer workflow patterns, and deep experience with forms, surveys, quizzes, AI-assisted creation, integrations, and results sharing.